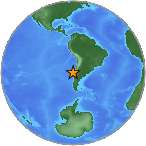
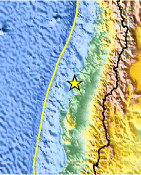
Magnitude 8.8 - OFFSHORE BIO-BIO, CHILE
2010 February 27 06:34:14 UTC
Earthquake Details
- This event has been reviewed by a seismologist.
| Magnitude | 8.8 |
|---|---|
| Date-Time |
|
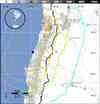
| Location | 35.909°S, 72.733°W |
| Depth | 35 km (21.7 miles) set by location program |
| Region | OFFSHORE BIO-BIO, CHILE |
| Distances | 95 km (60 miles) NW of Chillan, Chile 105 km (65 miles) NNE of Concepcion, Chile 115 km (70 miles) WSW of Talca, Chile 335 km (210 miles) SW of SANTIAGO, Chile |
| Location Uncertainty | horizontal +/- 6.2 km (3.9 miles); depth fixed by location program |
| Parameters | NST=391, Nph=391, Dmin=987.2 km, Rmss=1.17 sec, Gp=
14°, M-type=teleseismic moment magnitude (Mw), Version=8 |
| Source |
|
| Event ID | us2010tfan |
- The U.S State Department has set up a number for Americans to call if they are looking for infomation about relatives and friends: 1-888-407-4747. This line will receive a high number of calls however so you may hear a recording.
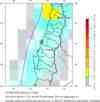
- Did you feel it? Report shaking and damage at your location. You can also view a map displaying accumulated data from your report and others.
Earthquake Summary
Felt Reports
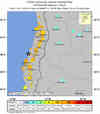
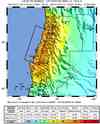
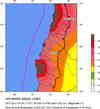
At least 523 people killed, 24 missing, about 12,000 injured, 800,000 displaced and at least 370,000 houses, 4,013 schools, 79 hospitals and 4,200 boats damaged or destroyed by the earthquake and tsunami in the Valparaiso-Concepcion-Temuco area. At least 1.8 million people affected in Araucania, Bio-Bio, Maule, O'Higgins, Region Metropolitana and Valparaiso. The total economic loss in Chile was estimated at 30 billion US dollars. Electricity, telecommunications and water supplies were disrupted and the airports at Concepcion and antiago had minor damage. The tsunami damaged or destroyed many buildings and roads at Concepcion, Constitucion, Dichato and Pichilemu and also damaged boats and a dock in the San Diego area, USA. Maximum acceleration of 0.65g was recorded at Concepcion and more than 2 m of uplift along the coast was observed near Arauco. Felt (IX) at Concepcion; (VIII) at Chiguayante, Coronel, Lebu, Nacimiento, Parral, Penco, Rancagua, Santiago, San Vicente, Talca, Temuco and Tome; (VII) from La Ligua to Villarrica; (VI) as far as Ovalle and Valdivia. Felt in Chile as far as Iquique and Punta Arenas. Felt (V) at Cutral-Co and San Juan; (IV) at Cordoba, Mendoza and San Carlos de Bariloche; (III) at Buenos Aires, Argentina and (II) at Sao Paulo, Brazil. Felt in much of Argentina and in parts of Bolivia, southern Brazil, Paraguay, Peru and Uruguay. Seiches were observed on Lake Pontchartrain, Louisiana, USA. A Pacific- wide tsunami was generated. Tsunami wave heights in centimeters (above sea level) were recorded at the following selected tide gauges: 71 at Pago Pago, American Samoa; 22 at Winter Harbour, Canada; 261 at Valparaiso, 181 at Talcahuano, 164 at Coquimbo, 144 at Corral, 118 at Arica, 90 at Caldera, 79 at San Felix, 68 at Iquique, 47 at Antofagasta and 40 at San Pedro, Chile; 33 at Rarotonga, Cook Islands; 105 at Santa Cruz and 41 at Baltra, Ecuador; 32 at Rikitea, French Polynesia; 95 at Hanasaki, 40 at Ofunato and 30 at Naha, Japan; 21 on Johnston Island; 15 on Saipan, Northern Mariana Islands; 32 on Midway Island; 65.5 at Acapulco and 35.9 at Cabo San Lucas, Mexico; 117 at Gisborne, 101 on Chatham Island, 98 at Owenga and 50 on Raoul Island, New Zealand; 37 at Manus, Papua New Guinea; 69 at Callao, Peru; 16 at Currimao, Philippines; 42 at Apia, Samoa; 63 at King Cove, 42 on Atka, 39 at Seward, 39 on Shemya, 36 at Kodiak, 36 at Yakutat and 23 at Craig, Alaska, USA; 91 at Santa Barbara, 64 at Crescent City, 60 at La Jolla and 46 at Point Reyes, California; 86 at Kahului, 51 at Kawaihae, 40 at Nawiliwili and 26 at Honolulu, Hawaii; 32 at Port Orford, Oregon; 23 at Neah Bay, Washington.
Tectonic Summary
The earthquake was generated at the gently sloping fault that conveys the Nazca plate eastward and downward beneath the South American plate. The two plates are converging at 7 meters per century. The fault rupture, largely offshore, exceeded 100 km in width and extended nearly 500 km parallel to the coast. The rupture began deep beneath the coast and spread westward, northward, and southward. As it spread, the fault slip generated earthquake shaking. The fault slip also warped the ocean floor, setting off the tsunami along the fault-rupture area.
The written history of very large plate-boundary earthquakes between ValparaÃso and Concepción probably begins with a shock near Concepción in 1562. Another earthquake eight years later set off a tsunami that led Spaniards to rebuild Concepción on higher ground. A 1730 earthquake probably centered near ValparaÃso generated a tsunami that caused flooding and damage in Japan, as did the great Concepción earthquake of 1751. Charles Darwin and Robert FitzRoy observed the next major Concepción earthquake in 1835. The northern part of the 2010 rupture overlaps with the probable source area of the 1906 ValparaÃso earthquake of magnitude 8.2. The tsunami associated with the 1906 earthquake produced damage in Hawaii, with reported run-up heights as great as 3.5 m.
Other parts of Chile’s coast have also produced notable earthquakes. South of Concepción, the source of the 2010 earthquake adjoins a fault rupture nearly 1,000 km long that produced the largest 20th-century earthquake worldwide – the giant 1960 earthquake of magnitude 9.5 An estimated 1600 lives were lost to the 1960 earthquake and tsunami in Chile, and the 1960 tsunami took another 200 lives among Japan, Hawaii, and the Philippines. At ValparaÃso, a plate-boundary earthquake of magnitude 8.0 occurred in 1985. North of ValparaÃso, a magnitude 8.5 earthquake in 1922 generated a Pacific Ocean tsunami that reached heights of 9 m on the Chilean coast near Coquimbo and washed away boats in Hilo harbor, Hawaii. Still farther north along the coast of Chile and Peru, great earthquakes with trans-Pacific tsunamis occurred are known from 1586, 1687, 1868, and 1877. Overall along the Chilean coast there have been 13 earthquakes of magnitude 7.0 or greater since 1973.
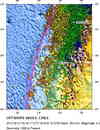
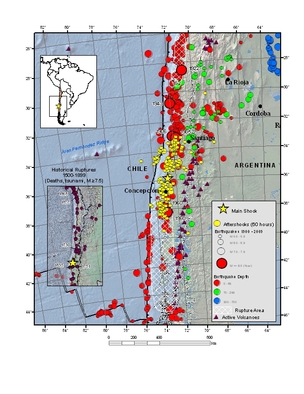 This map shows the spatial
relationship among instrumentally located earthquakes since 1900. Those before
1964 are of M6.5 or larger; those since 1964-present, M5.5 or larger. and the
2010/02/27 M8.8 Chile earthquake and its associated aftershocks. Since the
beginning of the 20th century there have been M8.2 earthquakes in 1906, 1943 and
1960 and an M8.0 in 1985. The M8.2 1960 earthquake was a foreshock that occurred
the previous day to the great M9.5 Chilean earthquake. The point of initial
rupture for the M8 or larger earthquakes are shown, while the estimated rupture
zones of the 1922 M8.5 and 1960 M9.5 earthquakes are also identified. These
rupture zones were defined by the areal extent of aftershocks and/or geological
and macroseismic observations. 

Since the middle of the 16th century, there is a comprehensive written record of other large damaging earthquakes throughout the region. Notable likely mega-thrust earthquakes prior to 1900 include earthquakes in 1868 and 1877 offshore southern Peru and northern Chile. In the vicinity of the 2010 earthquake, damaging earthquakes were reported in 1751, near Concepcion, and one further to the north in 1730. Tsunamis from the 1730, 1751, 1868, and 1877 earthquakes produced Pacific-wide tsunamis as evidenced from detailed records of flooding and damage in Japan. An 1835 Concepcion earthquake is notable because the great Explorers Charles Darwin and Robert FitzRoy provided observations and comments.
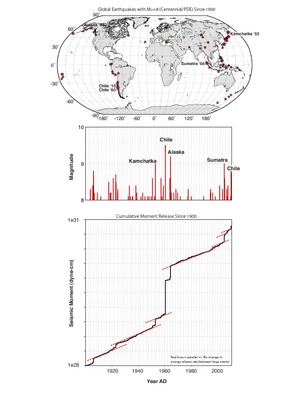 Does the recent earthquake
activity in Chile, Haiti, the western Pacific, and the Indian Ocean mean that
one earthquake is triggering the next? Probably not. Instead, as illustrated at
right, the global rate of earthquake energy release shows little if any
difference between times when very large earthquakes have been common and times
when they have not. The graphs and the map above them show the
temporal and spatial distribution of earthquakes with a magnitude of M >= 8
since 1900. On the global map, earthquake locations are denoted by red stars,
and the largest five are labeled with their location names and year of
occurrence. Below this map, earthquakes are displayed in graphic format; first
as a bar graph of earthquake magnitude through time, and next as cumulative
energy release (seismic moment) through time. As on the global map, the largest
five earthquakes are labeled on the bar graph. These graphs show that while the
largest earthquakes of the last 70 years occurred close together in time –
first during the 1950’s and 1960’s and again since 2000 – there has been
no appreciable increase in the rate of energy release between these large
events, as indicated by the parallel red dashed lines.
A statistical analysis of the same data shows no meaningful, statistically significant clustering of M>=8 earthquakes in time. In this analysis, not presented here, synthetic histories of randomly recurring earthquakes commonly include clusters similar to those of the last 70 years.
Aftershock Report
In the time period since the earthquake's origin at 2010-02-27 06:34 to 2010-04-26 21:00 UTC, the USGS NEIC has located 304 aftershocks of magnitude 5.0 or greater. 21 of these aftershocks have magnitudes of 6.0 or greater. See Aftershock Map
Earthquake Information for Chile
Earthquake Information for South America
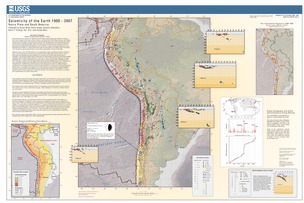
Poster of the Seismicity of
the Nazca Plate and South America
Educational slides for the M7.0 January 12, 2010 and M8.8 February 27, 2010 Chile earthquakes.
Earthquake Maps
Scientific & Technical Information
 Tsunami
Information
The earthquake locations and magnitudes cited in NOAA tsunami statements and bulletins are preliminary and are superseded by USGS locations and magnitudes computed using more extensive data sets.
General Tsunami Information
- Preliminary Earthquake Report
- U.S. Geological
Survey, National Earthquake Information Center:
World Data Center for Seismology, Denver

